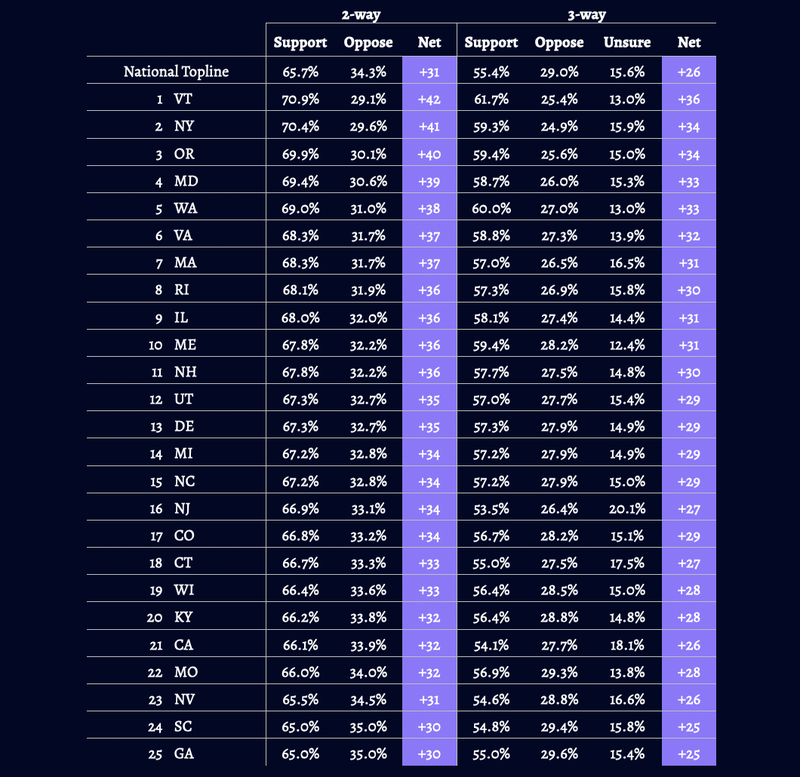
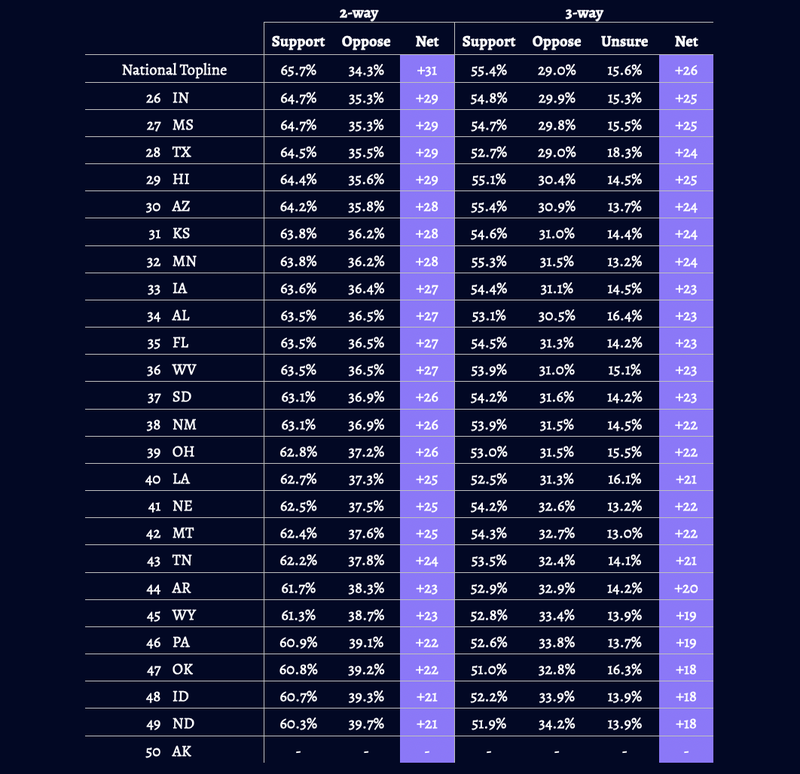
A new poll from More Perfect Union found that more than 65 percent of Americans support lowering the Medicare eligibility age from 65 to 60 – including a majority in every state. Nationally, more than 50 percent of Trump voters say they support “the Biden administration’s… plan to lower the eligibility age for Medicare from 65 to 60.” And in states Trump won by large margins such as Utah and Kentucky, more than 66 percent say they support lowering the eligibility age to 60.The plan is especially popular with 35-49 year olds (75 percent support) and Black Americans (72 percent support). Support for the plan is above 60 percent in every state. The poll sampled over 4,000 likely voters nationwide.
Broad Support for Medicare Expansion
Most people age 65 or older are eligible for free Medical hospital insurance if they have worked and paid Medicare taxes long enough. The Biden administration is proposing a plan to lower the eligibility age for Medicare from 65 to 60.Do you support or oppose this plan?

Lowering the Medicare eligibility age to 60 could expand Medicare coverage to 23 million people, including nearly 2 million uninsured people.Twenty-seven percent of adults age 50 to 64 are not confident that they can afford health insurance over the next year, and studies have found that there is a massive spike in the diagnosis of cancer among Americans who reach the age of 65 that could have been diagnosed earlier if the Medicare eligibility age were lower.
Expanding Medicare Is Popular in Every State


Dates in Field: April 26 to April 27, 2021Respondent Universe: U.S. population of likely votersSample size: 4,035 Margin of error: ± 2% (adjusted for weighting)Survey mode: Mobile and web-based interviews including matched respondentsMethod: Sample weighted on gender, age, race/ethnicity, education, vote history, and sociocultural characteristicsNote: Cross tabulated results are not available for Alaska due to inadequate sample


